
Explore neighborhoods, home maintenance, design, and market trends
news and blog for homebuyers, sellers, and homeowners
housing inventory, mortgage rates, and market trends
(updated Monday, 8/27/2025)
-

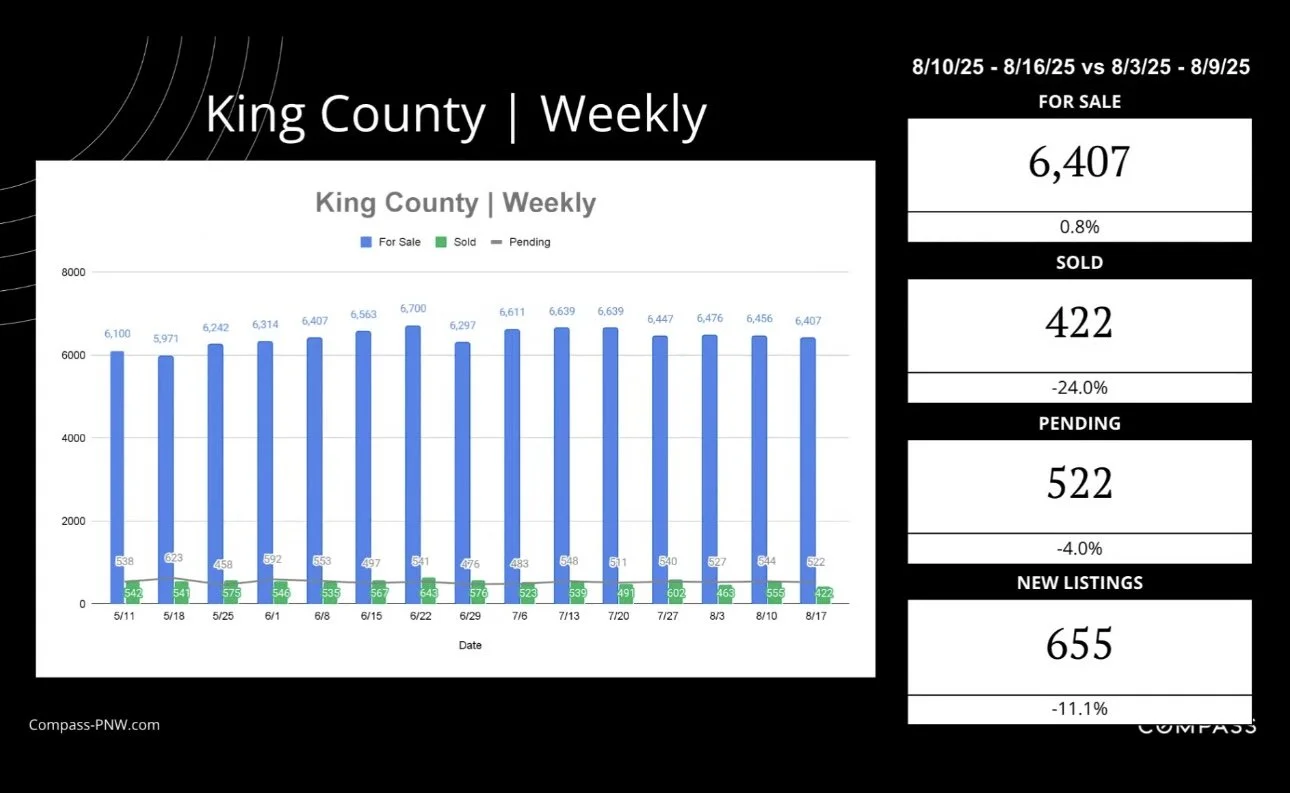
Housing Inventory: 6,596* King County home listings - Expect sustained large number of new listings through Summer with buyer activity/absorption rates fluctuating in regular seasonal patterns. Inventory typically peaks in August/ September with new listings peaking in July/August.
*Avg between 3-7K -

Mortgage Rates: 6.51%* (avg 30yr fixed**), up m/m, up w/w, volatile, but in the expected 6.5-7 range expected of 2026
https://www.mortgagenewsdaily.com/mortgage-rates/30-year-fixed
*based on survey of 200 lenders top tier current loans (usually 15% down, 680+ credit)
**“Average 30yr fixed“ is standard for reporting - The 50 year average of the “average 30-year fixed” is ~7.75%. -

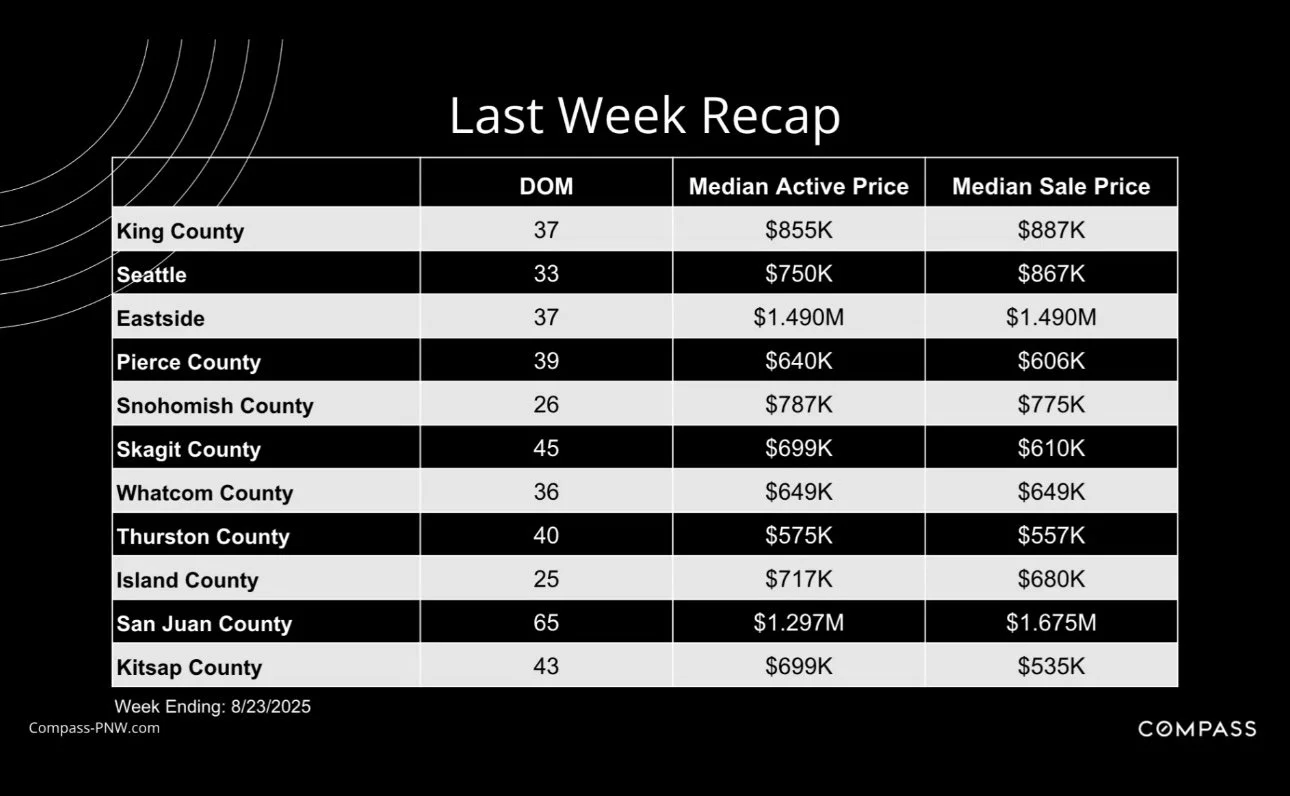
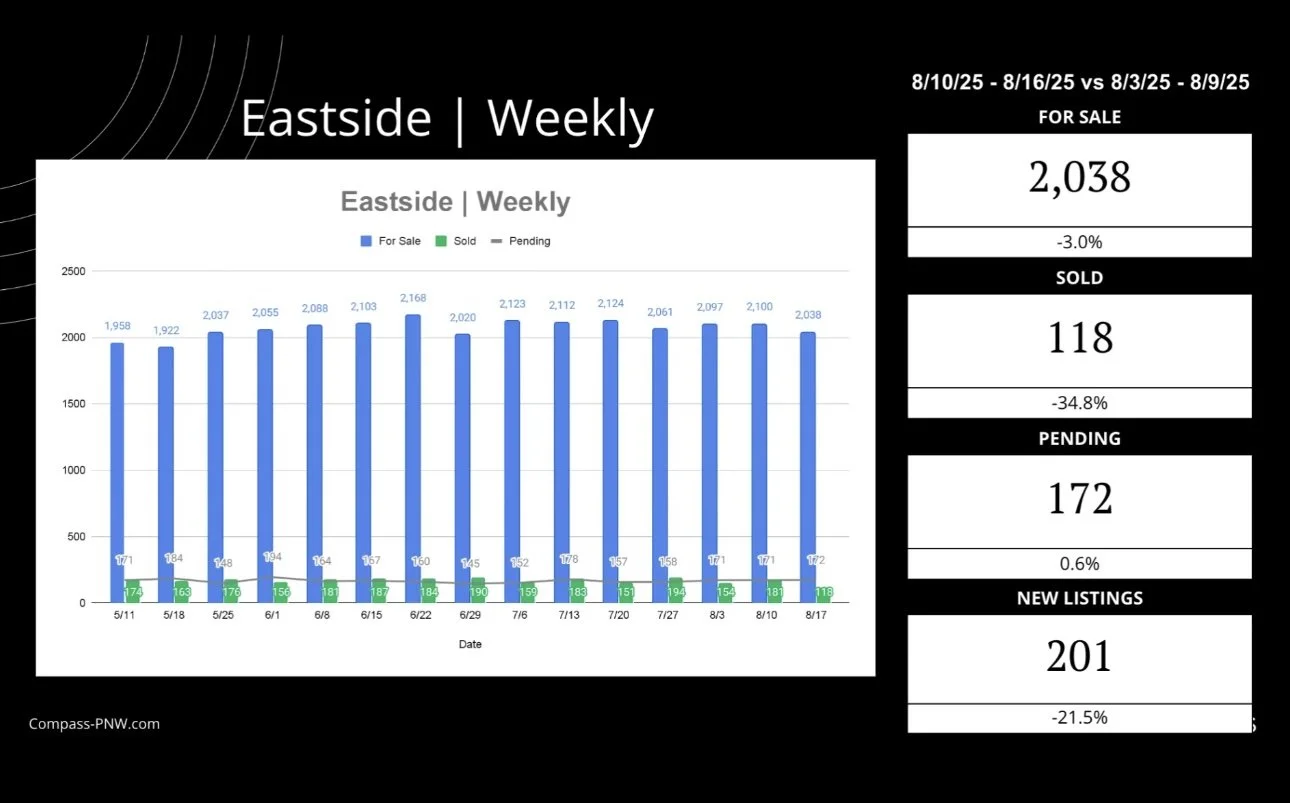
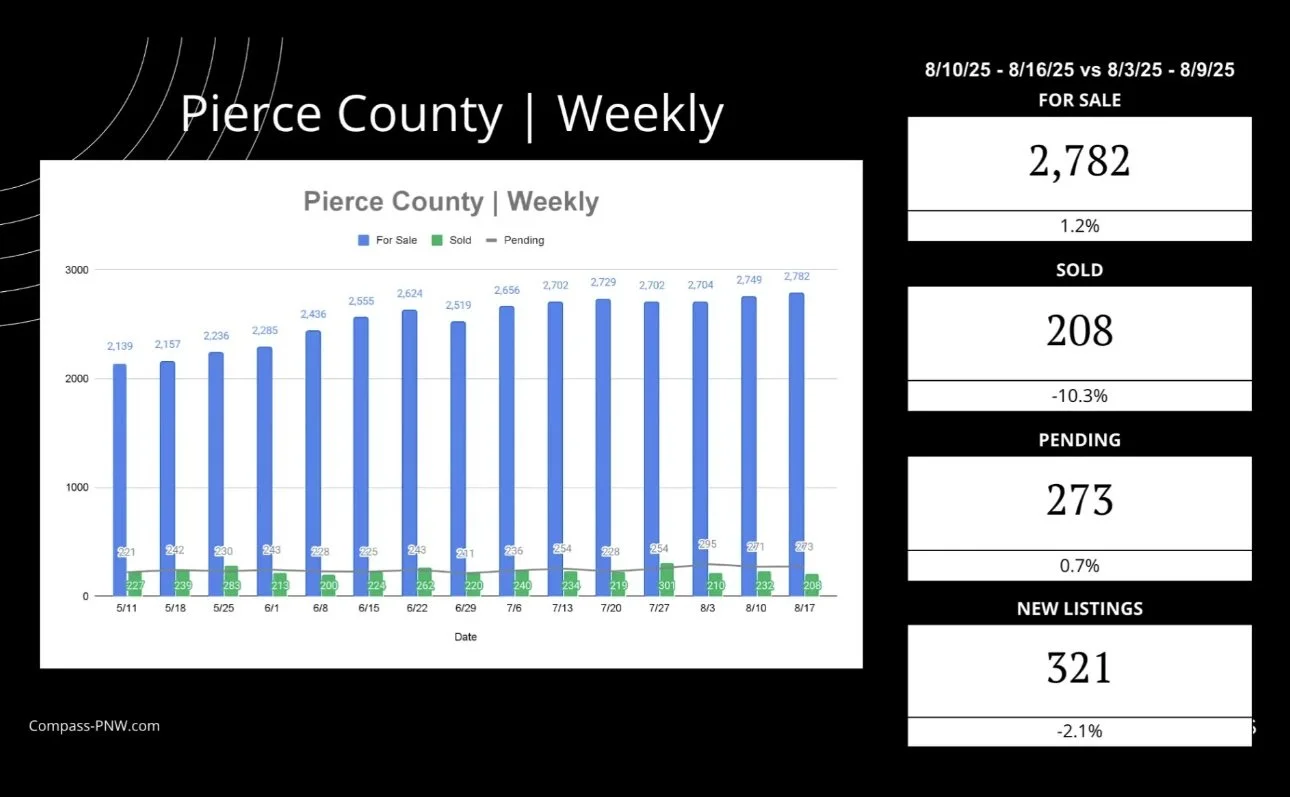
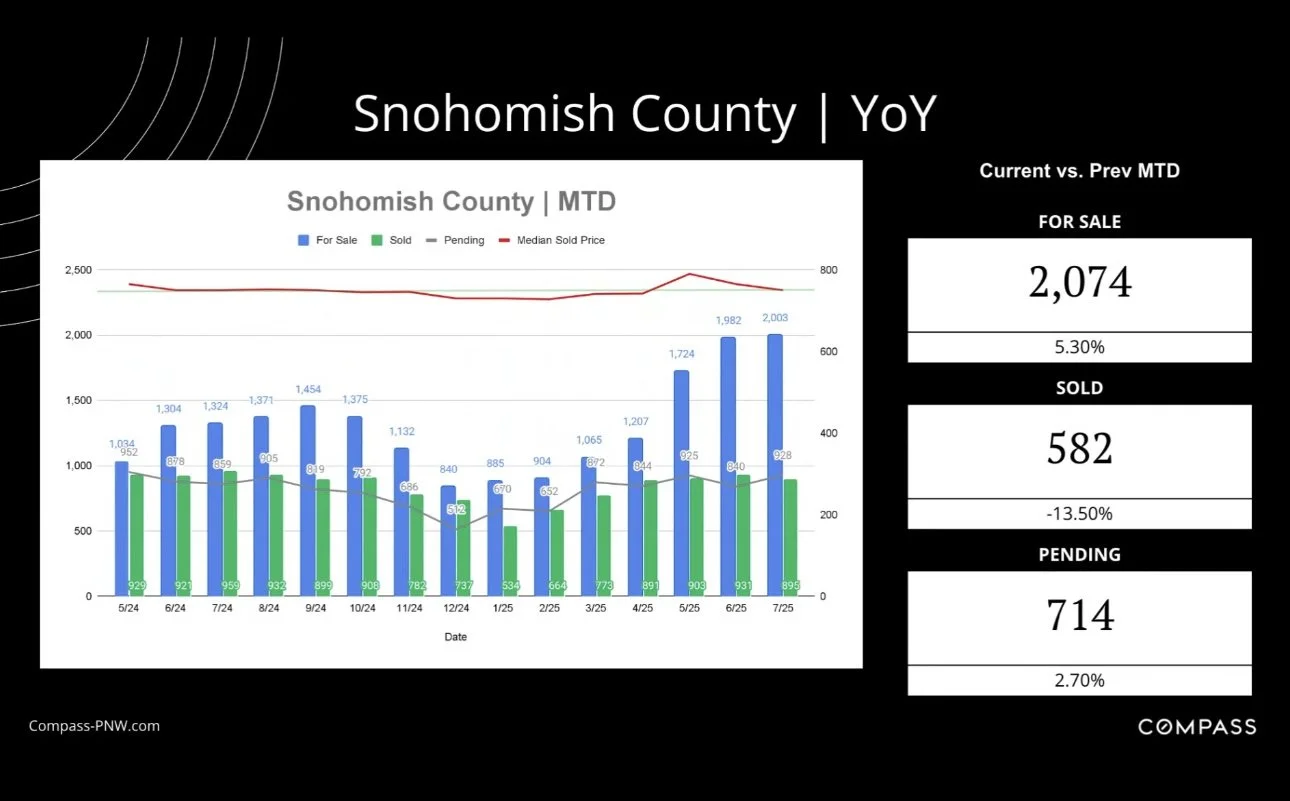
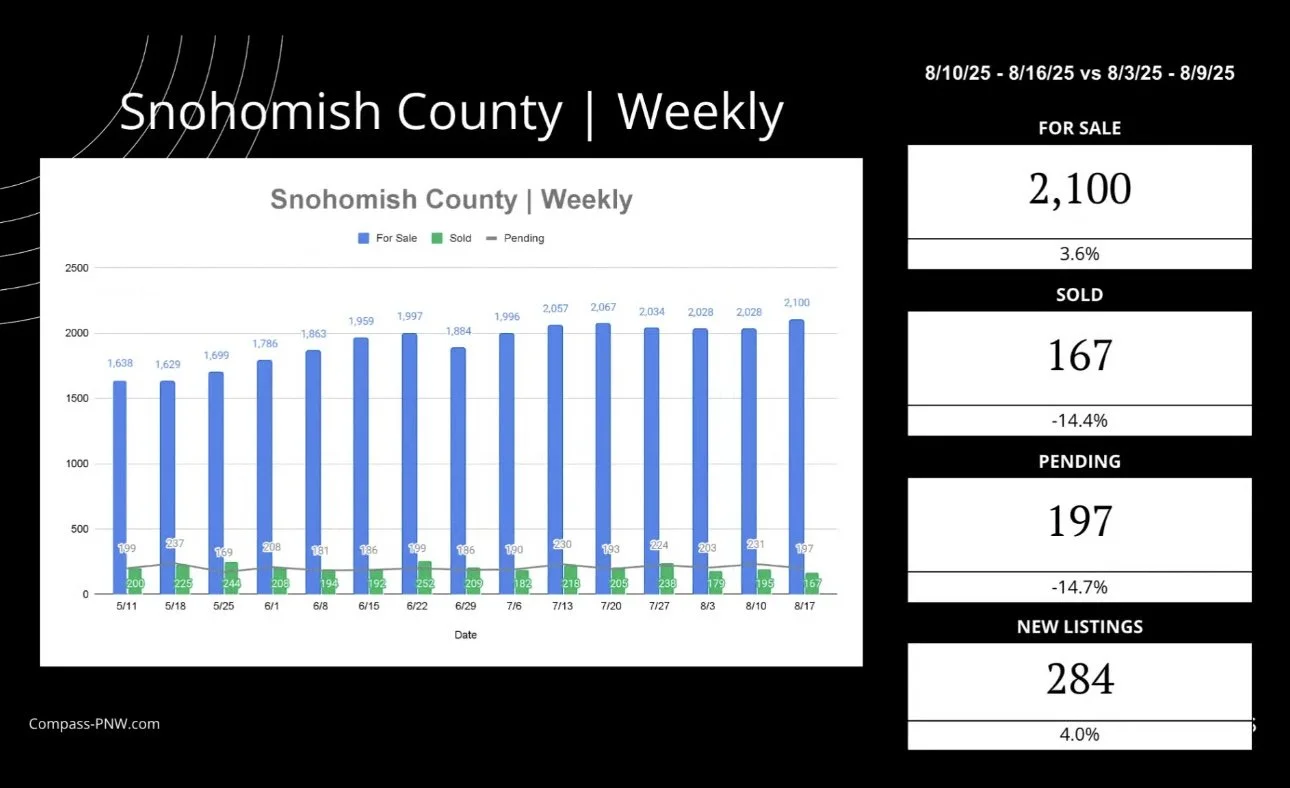
Weekly results highlight the softer seasonal rhythm as mid-August activity cools. New listings slowed in most areas (e.g., King County -6.1%, Pierce -6.9%, Kitsap -10.4%), consistent with sellers delaying until after summer vacations. Despite this, several markets still saw stronger pendings or sales: Snohomish County pendings surged +16.2% and San Juan County saw a +66.7% spike in closings—likely due to a handful of high-value transactions. Conversely, Island County experienced a sharp -37.1% drop in sales and -20.9% pendings, showing the volatility of smaller markets. Median prices largely held steady across the region, while days on market hovered in the 26–38 day range, underscoring that buyers remain active but less urgent during the summer lull.
-

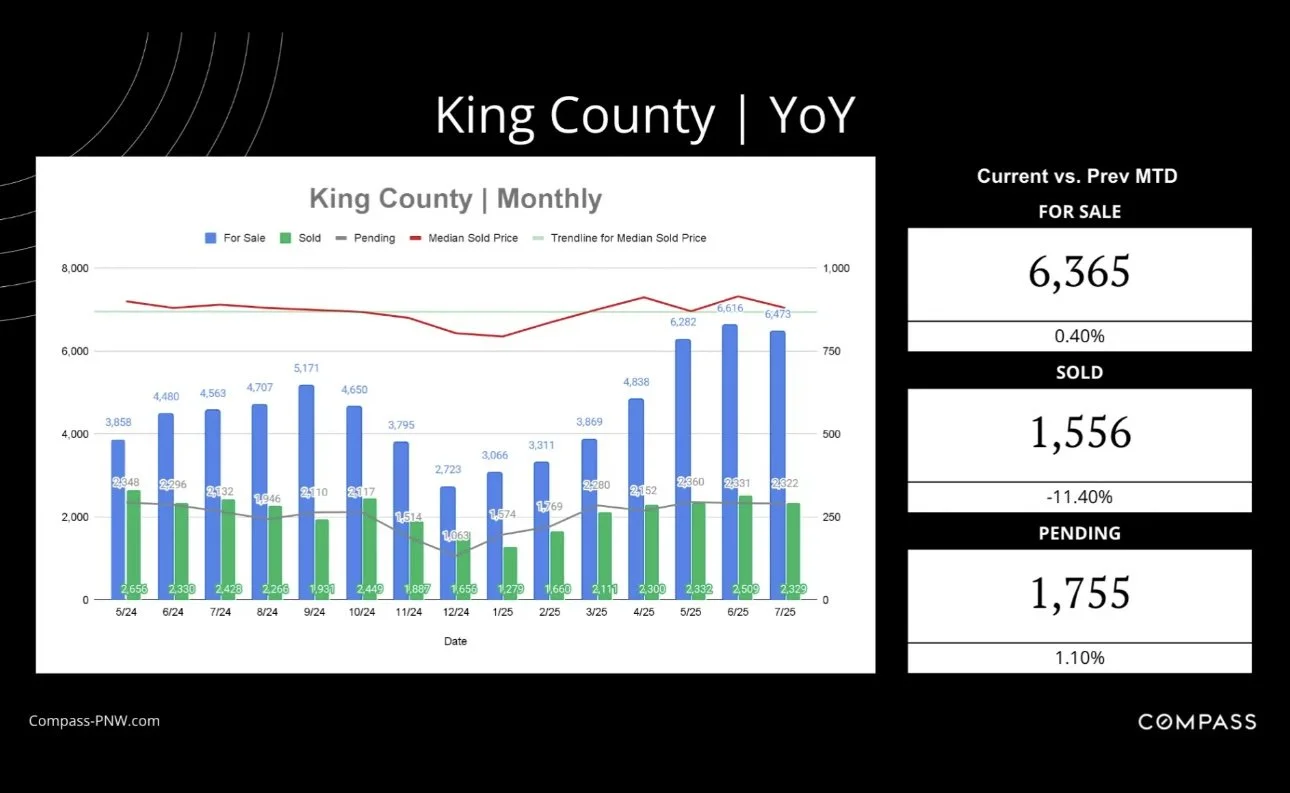
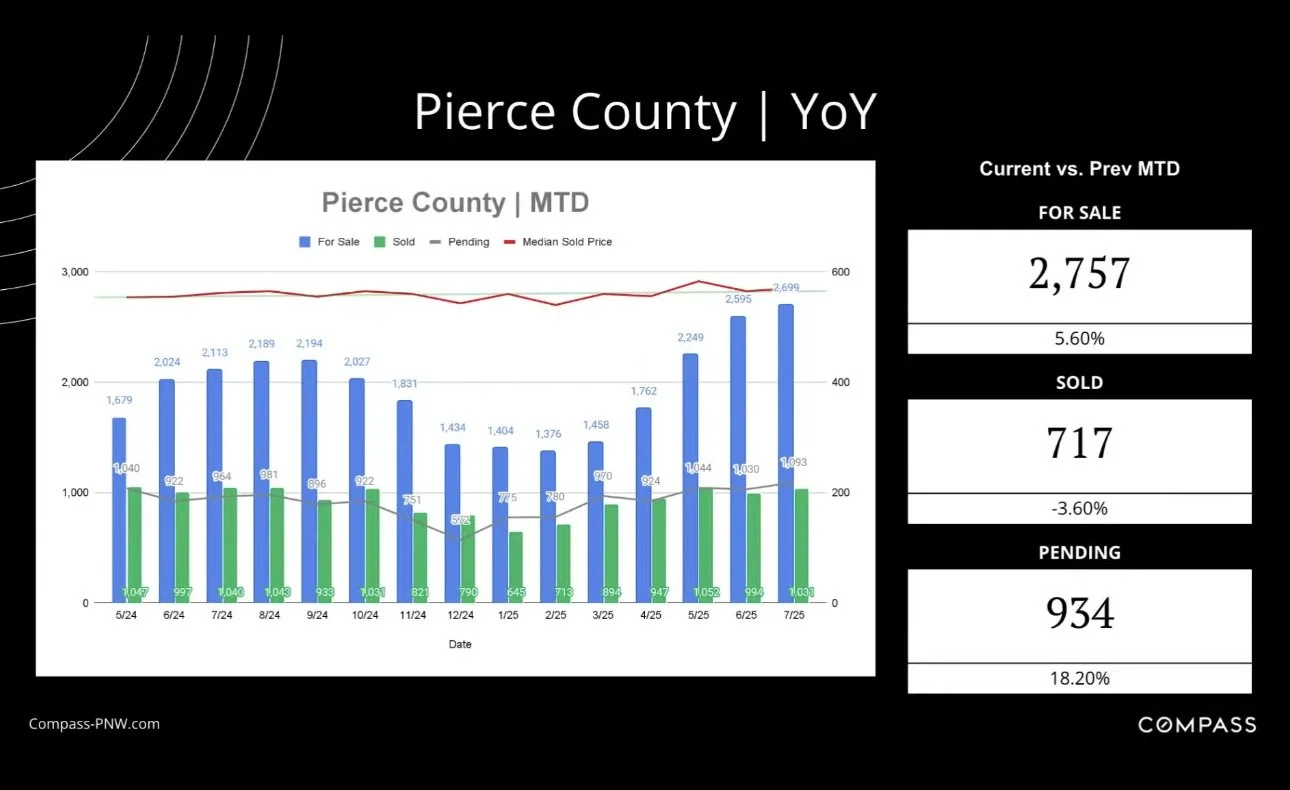
Across the Puget Sound region, August’s MTD data reflects a typical summer slowdown in sales activity, with most counties showing year-over-year declines in closings. King County (-15.3%), Snohomish (-17.0%), Thurston (-27.3%), and Whatcom (-28.4%) all report lower sold volumes compared to last year, signaling that many buyers and sellers are stepping back during peak travel months. However, pending sales remain a bright spot, with gains in Pierce (+21.3%), Snohomish (+8.6%), and Whatcom (+34.4%), suggesting continued demand that may translate into stronger closings later in the fall. Active inventory has crept up modestly in most markets, aligning with seasonal listing patterns where new supply tapers but doesn’t disappear, keeping buyers’ options relatively steady.
Weekly Stats
July Stats
Avg Showings to Pending: 11
Avg Showings Per Listing: 3.9
Avg Condo Showings to Pending: 6
Avg Condo Showings Per Listing: 2.8
Blog


Newsletter
Join the hundreds of informed buyers, sellers, and homeowners
To stay updated with buying, accessorizing, maintaining & updating a home in Seattle